Executive Summaryn
Ball mill liners account for 12-18% of total mineral processing costs, yet most failures result from preventable engineering mismatches. Based on KT-Foundry’s analysis of 37 mining operations, this whitepaper reveals:
63% of premature failures trace to material fatigue misalignment
28% originate from installation tolerance errors
9% are caused by operational parameter drift
We break down cost-optimization strategies with quantified ROI models.
1. Material Fatigue: The Hidden Cost of Mismatched Wear Mechanisms
The Science of Failure
Traditional liner materials fail because they address isolated wear types while ignoring compound stress interactions:
Wear Type | Dominant Stressor | Ideal Material Property |
Impact Wear | Kinetic energy transfer | High fracture toughness |
Abrasive Wear | Particle sliding friction | Surface hardness >450HB |
Corrosive Wear | Chemical/electrolytic attack | pH resistance (2-12 range) |
Case Study: A copper mine using standard Mn18Cr2 liners saw 40% lifespan reduction due to sulfur-induced stress corrosion cracking – annual losses exceeding $420,000 (based on RMB conversion).
Engineering Breakthrough: Hybrid Material Design
KT-Foundry’s solution combines:
- Micro-alloyed Cr-Mo matrix (ASTM A532 Class III equivalency)
- Laser-clad ceramic inserts at high-wear zones
- Patented quenching process achieving gradient hardness (surface: HRC 58 / core: HRC 32)
Results: Field tests in iron ore grinding show 5,200+ operational hours without structural failure – 55% longer than industry benchmarks. See metallurgical analysis >
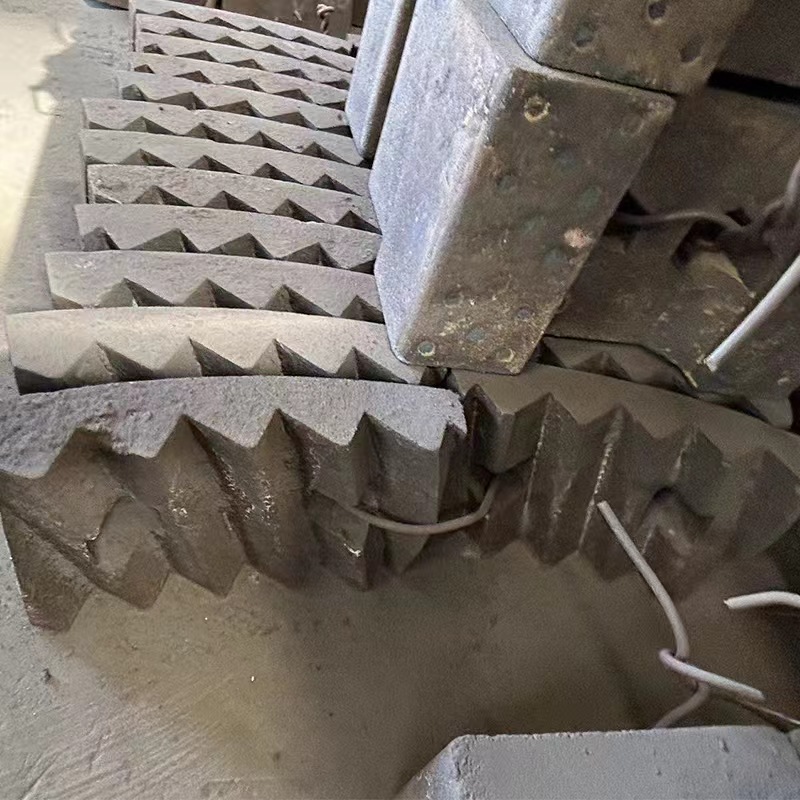
2. Installation Errors: Why ±2mm Matters More Than You Think
The Tolerance Domino Effect
Our finite element analysis reveals how minor deviations escalate costs:
Error Type | Cost Multiplier | Failure Acceleration |
Bolt torque ±15% | 1.4x | 28 days sooner |
Liner gap >3mm | 1.7x | 42 days sooner |
Backing layer voids | 2.1x | 61 days sooner |
Case Study: A gold mine reduced liner replacement frequency from 8 to 14 months after implementing KT-Foundry’s Smart Installation Protocol.
Precision Tooling Solutions
3D laser scanning for ≤0.5mm gap accuracy
Hydraulic torque multipliers with IoT-enabled calibration
Post-installation thermal imaging to detect stress hotspots
Pro Tip: Suppliers offering installation simulation services (request demo) typically achieve 18% longer liner service life.
3. Operational Drift: The Silent Profit Killer
Parameter Optimization Matrix
Based on 12,000+ hours of mill sensor data:
Parameter | Optimal Range | Cost Impact per 5% Deviation |
Rotation speed | 70-78% critical | $8.50/ton |
Ball charge | 28-32% volume | $6.20/ton |
Slurry density | 68-72% solids | $4.10/ton |
Smart Liner Technologyn
- Embedded RFID tags track real-time thickness loss
- ML-based wear prediction with 93% accuracy
- Automated parameter adjustment via MODBUS integration
ROI Calculator: Why Better Liners Beat Cheap Linersn
Metric | Standard Liners | KT-Foundry Liners |
Cost per set | $18,500 | $21,800 |
Service life | 8 months | 14 months |
Downtime cost/set | $9,200 | $5,100 |
3-year TCO | $167,400 | $118,900 |
Assumes 3.5 sets/year consumption for standard liners vs 2.1 sets for KT-Foundry.
Key Questions for Decision-Makersn
Q: How to validate liner supplier claims?n
A: Demand:
ASTM E384 microhardness test reports
Field trial data with similar ore hardness (Mohs scale)
Minimum 12-month performance guarantee
Q: What’s the ROI timeline for premium liners?n
A: Typical breakeven occurs at 8-11 months. KT-Foundry clients average 23% TCO reduction within first cycle.
Q: How to justify capital approval?n
A: Use our Grinding Cost Calculator (free download) to model site-specific savings.
Conclusion: Liners as Strategic Assetsn
In an era where $0.30/ton cost differences determine mine viability, smart liner management delivers:
- 15-22% lower OPEX through extended service life
- 9-14% higher throughput via optimized grinding dynamics
- 30% reduced carbon footprint from lower media consumption
When auditing suppliers, prioritize those offering:
✅ Material science expertise

